Github Repo Tracker / 2026
GITHUB TRACKER BOARD
Track, analyze, and visualize GitHub activity in one powerful dashboard.
Role
Full Stack Developer
Client
OWN
Core Stack
Frontend: Next.js / React / Tailwind CSS / TypeScript Backend: Node.js / Express.js Database: MongoDB / Redis Authentication: GitHub OAuth Charts: Recharts Deployment: Vercel and Render
Overview
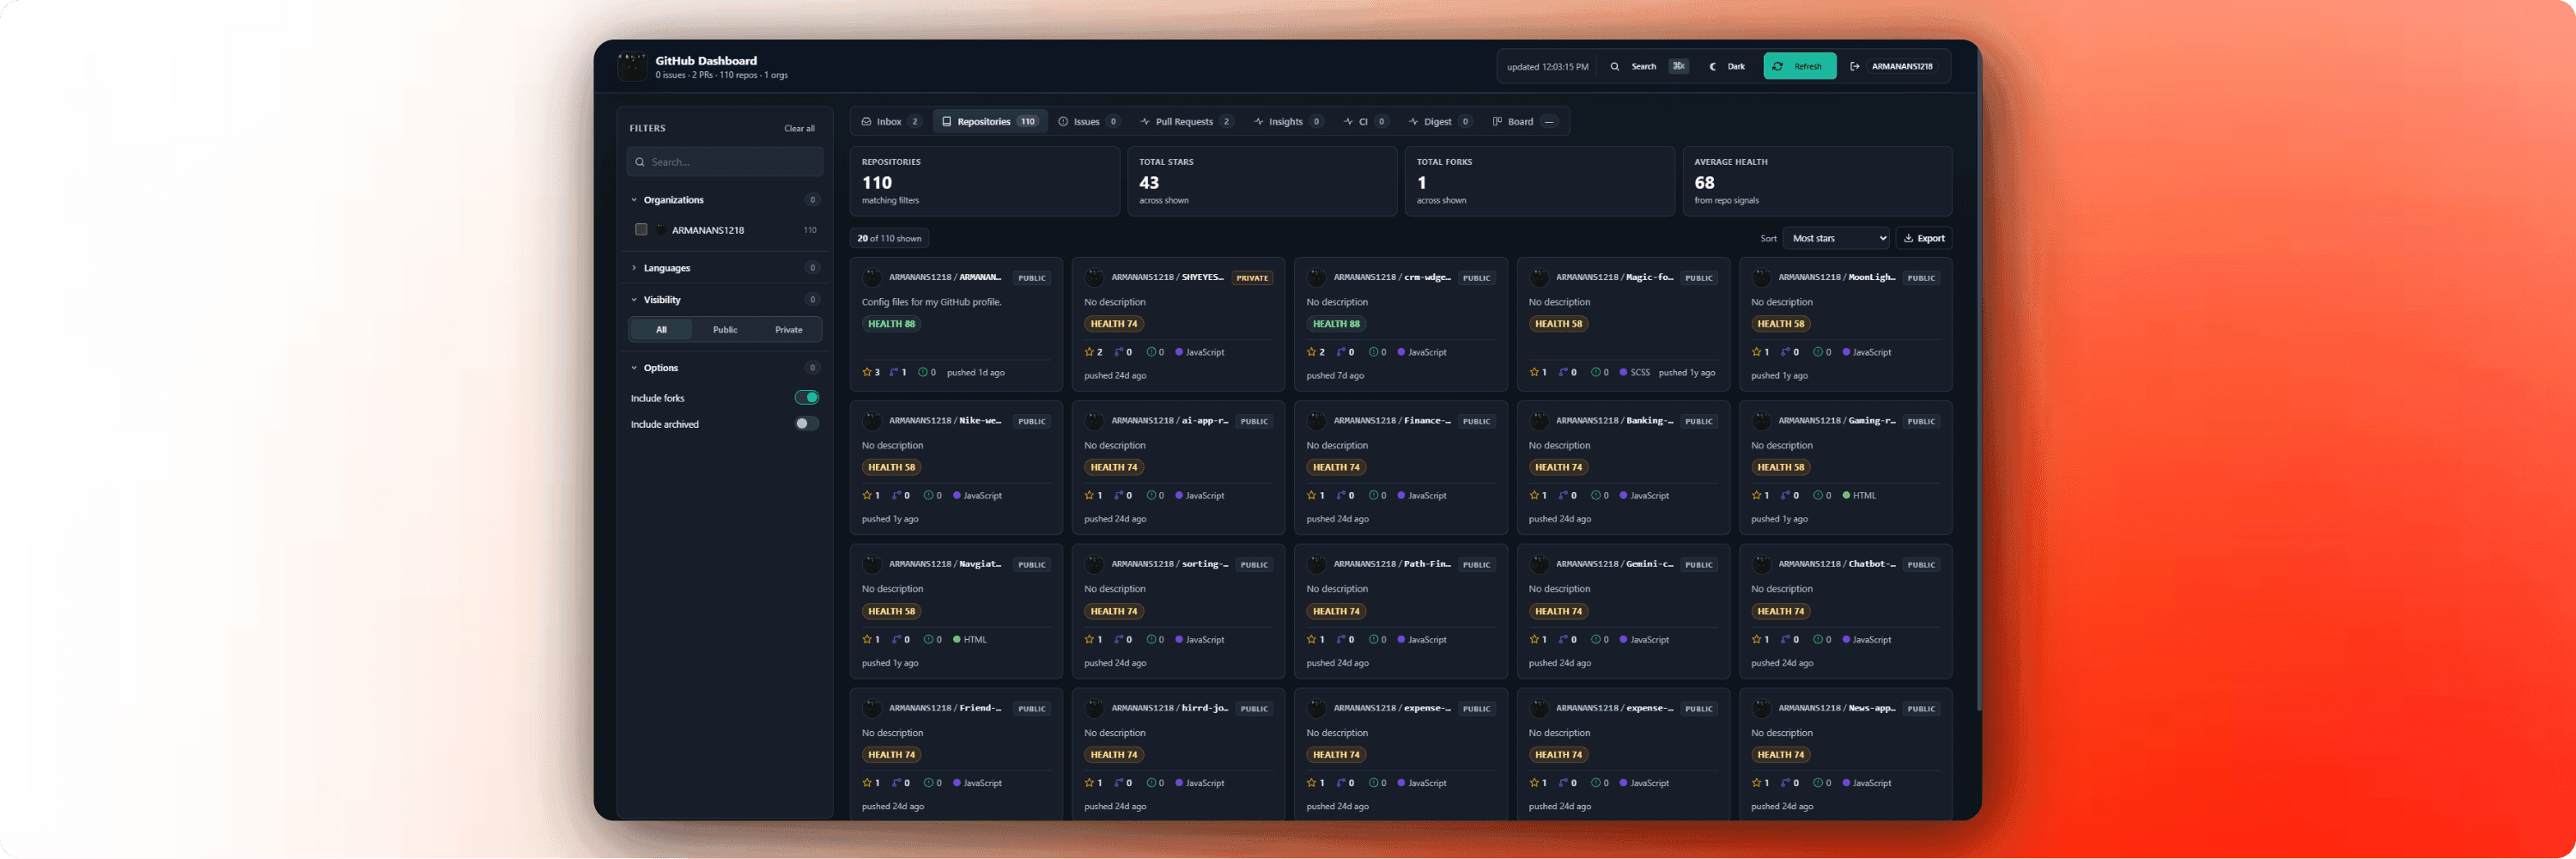
GitHub Tracker Dashboard is a comprehensive platform designed for developers and teams to gain deep insights into their GitHub repositories. It provides real-time statistics, contribution analytics, commit history, issue tracking, pull request monitoring, and performance metrics through interactive charts and visualizations.
Challenge
Building a dashboard that could fetch and process large amounts of data from the GitHub API while staying fast and responsive was the primary challenge. The application needed to handle API rate limits, synchronize repository data efficiently, cache frequently requested information, and present complex analytics such as commits, pull requests, issues, and contributor statistics through interactive visualizations.
Solution
I developed a full-stack architecture using Next.js for the frontend and Express.js with Node.js for the backend. GitHub OAuth was implemented for secure authentication. Repository and analytics data were stored in MongoDB, while Redis was used to cache API responses and reduce rate-limit issues. On the frontend, I used Recharts to create dynamic visualizations for commits, issues, pull requests, and contribution trends. The application was deployed using Vercel and Render.
Key Highlights
GitHub OAuth Authentication
Repository Analytics Dashboard
Commit Activity Tracking
Pull Request Monitoring
Issue Tracking
Contributor Leaderboard
Interactive Charts
Redis Caching
Real-Time Data Sync
Dark and Light Mode
Continue Exploring